Viewing experiment results
Overview
You can view your experiment results from the Experiments page. This page provides a centralized view of all experiments and allows you to quickly access performance metrics, significance levels, and summary details for each treatment group.
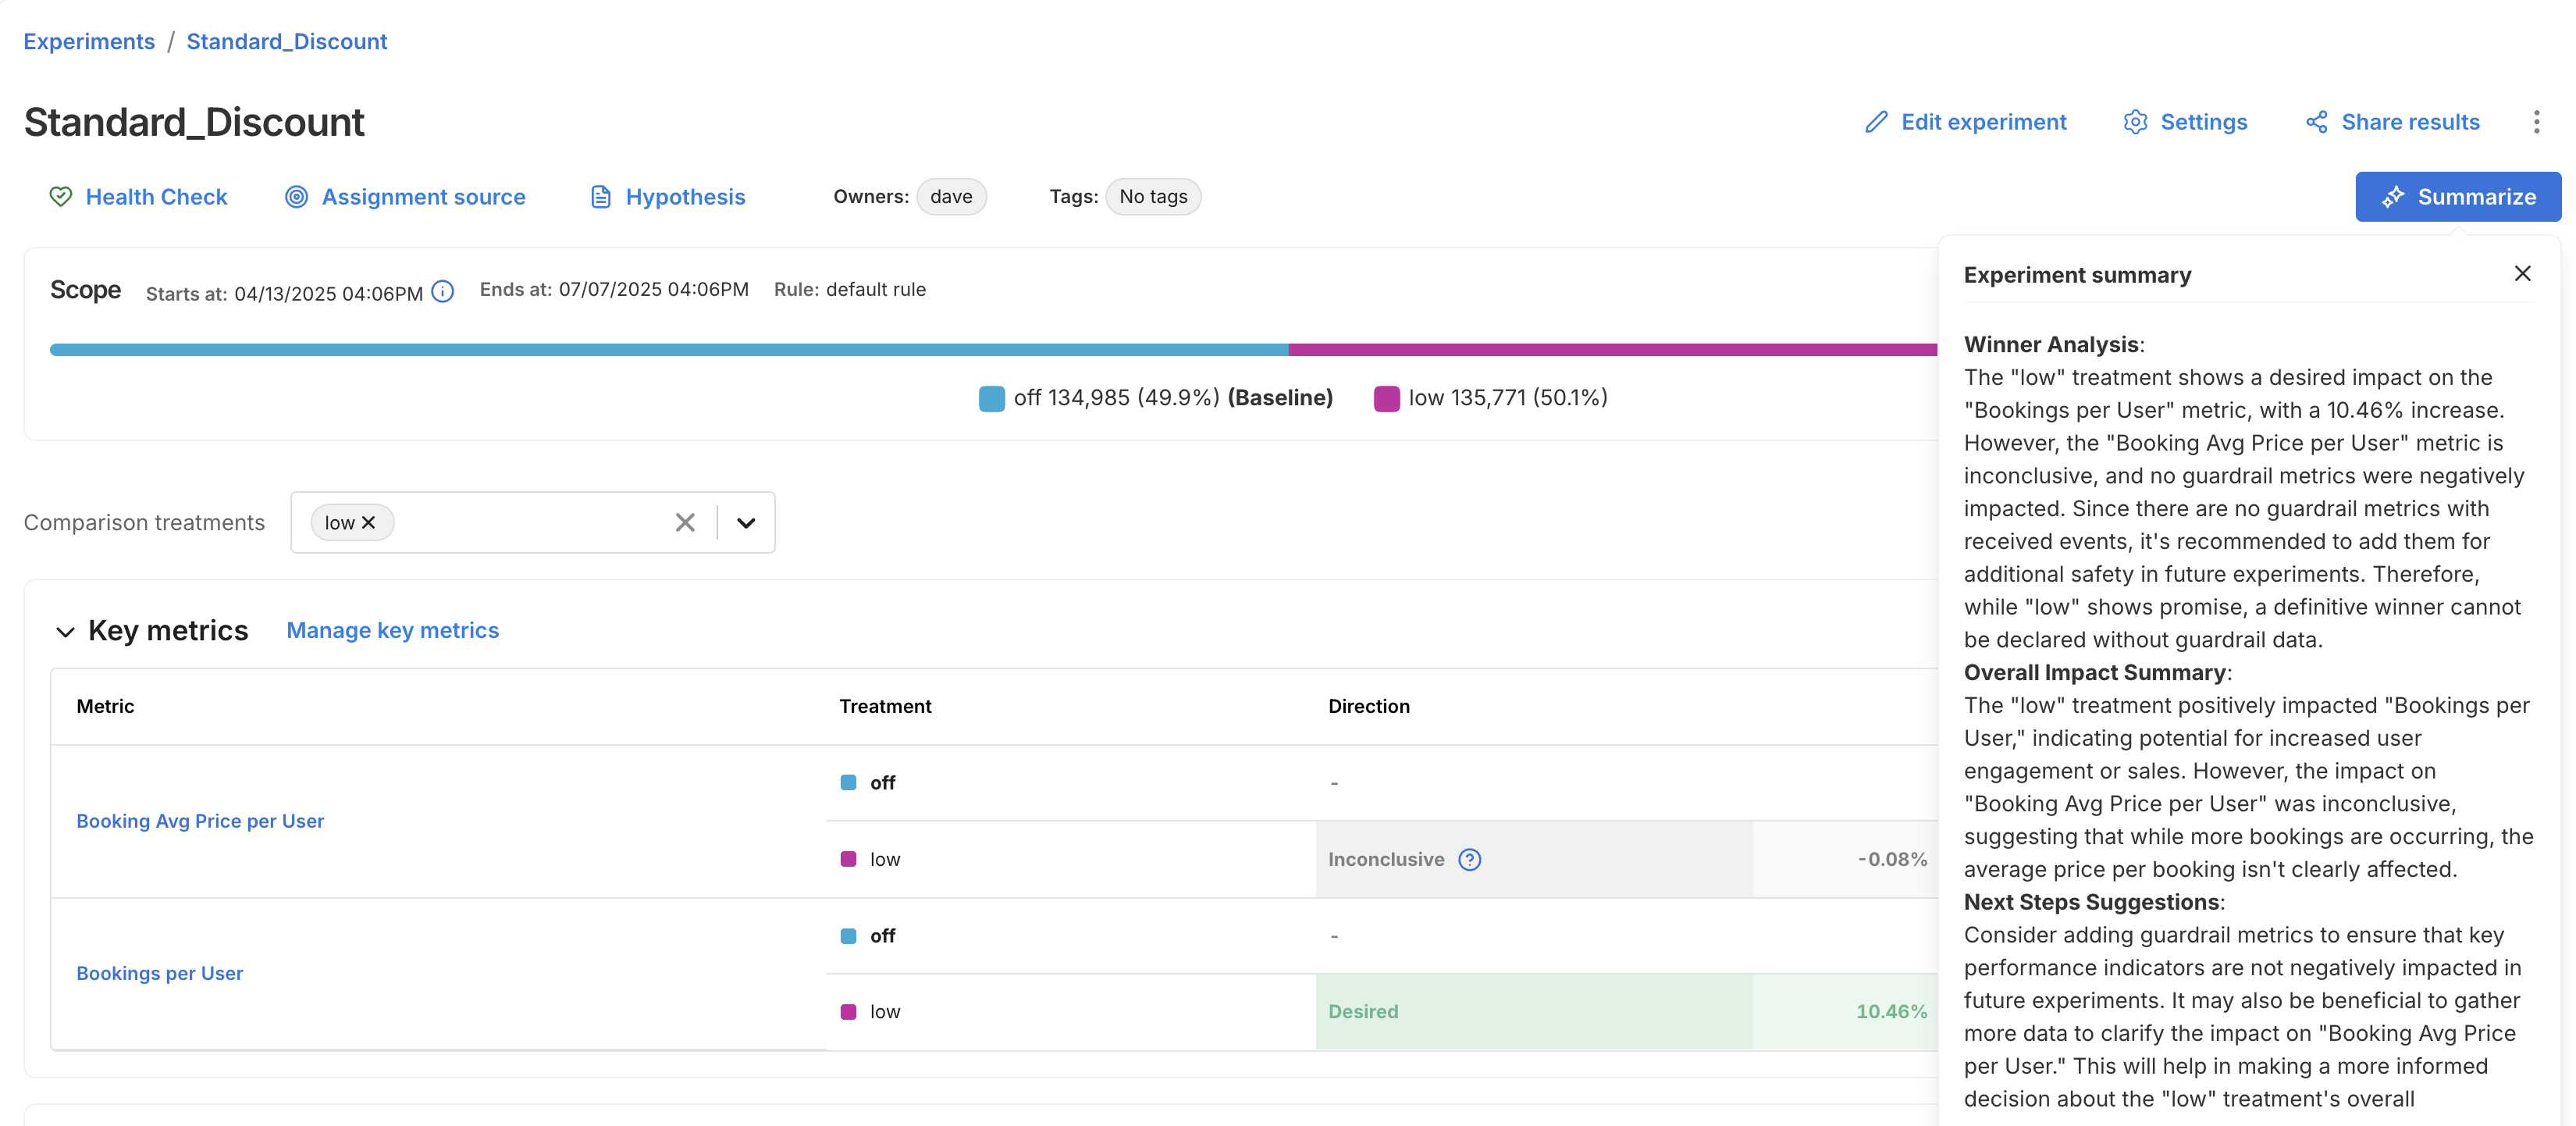
Click into any experiment to view detailed results, including the following:
-
Experiment metadata, such as:
- Experiment name, owners, and tags
- Start and end dates
- Active targeting rule
- Total number of exposures
- Treatment group assignment counts and percentages
-
Treatment comparison, including:
- The baseline treatment (e.g.
off) - One or more comparison treatments (e.g.
low)
- The baseline treatment (e.g.
Use AI Summarize
For faster interpretation of experiment outcomes, the Experiments page includes an AI Summarize button. This analyzes key and guardrail metric results to generate a summary of your experiment, making it easier to share results and next steps with your team.

The summary is broken into three sections:
- Winner Analysis: Highlights whether a clear winner emerged across key metrics and guardrails.
- Overall Impact Summary: Summarizes how the treatment impacted user behavior or business outcomes.
- Next Steps Suggestion: Recommends what to do next, whether to iterate, roll out, or revisit your setup.
Viewing metrics
To view the impact of your feature rollout on your account's metrics, from your selected feature flag, click the Metrics impact tab. The metric cards show how your account's metrics change when comparing treatments against your flag's baseline treatment.
Before getting started, review the following:
- Understand how your most important metrics (overall evaluation criteria) were both positively and negatively impacted to learn more about what your customers expect and how you should change your feature functionality.
- Compare the actual impact with your team's preliminary hypothesis.
- Ensure that you understand the impact and tradeoffs on your account's guardrail and performance metrics.
- Share the impact with your team.
The Metrics impact tab is described as follows:
- View impact for. Select the version or a custom date, targeting rule, and treatments that you want to compare. When you select the treatment, you can see the number of unique keys in that treatment. For more information, refer to the Apply filters guide.
- Summary of metrics impact. View how long your measurements have been running, and the last update time for the metrics displayed below. You can also force a recalculation of your metrics by clicking the Recalculate metrics button. This recalculation usually takes around 5 minutes but is dependent on the length of your experiment and the size of your data.
- Filter metrics. Filter down to metrics with a positive or negative impact by clicking the tile. You can deselect and view all by clicking the tile again.
- Key metrics. Select the key metrics that you want to monitor to help you evaluate the success of this feature. Learn about Configuring feature flag alerting for your key metrics. Key metrics are recalculated on a schedule, or when you click the Recalculate button.
- Guardrail metrics. Globally protected guardrail metrics adhere to an account-wide alerting policy. See the Metric definition page for more information. Guardrail metrics are recalculated on a schedule, or when you click the Recalculate button.
- Supporting metrics. Select the supporting metrics that you want to monitor for this experiment or feature rollout. These metrics should be important to you, but may not be your primary success metrics for this feature. Supporting metrics are recalculated on a schedule, or when you click the Recalculate button.
To learn more about analyzing and filtering data on the Metrics Impact tab, see Applying filters.
For detailed information about specific metric cards, refer to Understanding metric impact.
Automated calculation frequency
Automatic calculations are run for feature flag versions that include a percentage targeting rule. The duration between automatic calculations scales with the length of the version since the longer the experiment has run, the less likely that the data collected in the last few hours can move the metric. You can see the last calculation time on the Metrics impact tab.
The automated calculation schedule is:
- After 5 minutes, then
- After 30 minutes, then
- After 1 hour, then
- Every 1 hour until 12 hours, then
- Every 2 hours until 24 hours, then
- Every 1 day until 7 days, then
- On day 14, then
- On day 21, then
- On day 28
Manually recalculating metrics
You can manually run calculations on-demand by clicking the Recalculate button. Recalculations can be run for key metrics only, or for all metrics (key, guardrail, and supporting). Most recalculations take up to five minutes, but can take longer, depending on the size of your data and the length of your experiment.
Reasons you may choose to recalculate metrics:
- If you create or modify a metric after the last updated metric impact calculation, recalculate to get the latest results.
- If you assign a metric to the Key metrics or Supporting metrics groups, recalculate to populate results for those metrics.
- If the current version of this feature flag was created more than 28 days ago, recalculate to update results with the most recent data. Note that FME’s data retention period is 90 days. The influence of data points prior to 90 days are lost, even if the feature flag version is older than 90 days.
The Recalculate button will be disabled when:
- No impressions for this version are received within the current retention period (i.e., the last 90 days). To enable the recalculation, check that the SDK is correctly initialized in your code and verify that the metric event was sent.
- A forced recalculation is already scheduled. A calculation is in progress. You can click the Recalculate button again, as soon as the currently running calculation finishes.
If you have questions or need help troubleshooting, contact support@split.io.